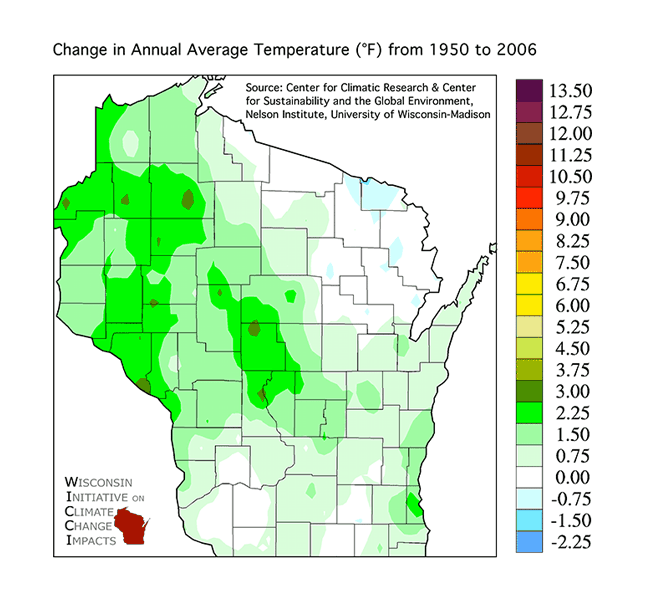
The source of observed temperature data was 176 weather stations measuring daily maximum temperature, minimum temperature, and precipitation during 1950-2006 in and around Wisconsin, from the National Weather Service’s Cooperative Observer Program. This data was interpolated to an 8-km grid (Serbin and Kucharik, 2009). Daily average temperature was estimated by averaging the daily maximum and minimum temperatures. Trends were estimated using the slopes of linear regression fits for the entire 1950-2006 time series.