Data visualizations enable insights from large data sets in a clean and efficient way. These visualizations have been developed by CCR scientists for their own use and for the general public, and include interactive maps, plots, and other appealing graphics. These visualizations are available for use by the community.
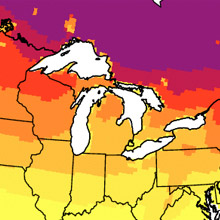
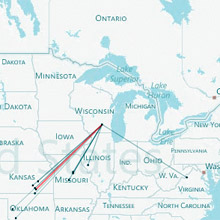
Dynamical Downscaling for the Midwest and Great Lakes Basin
Plot future projected trends in climate over the Midwest U.S. and Great Lakes Basin using CMIP5 dynamically downscaled data.
Contact: Michael Notaro, mnotaro@wisc.edu
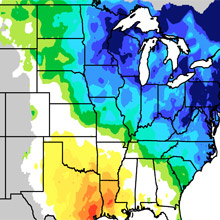
Central-Eastern North American Landscape Conservation Cooperatives (LCCs)
Plot future projected tends in climate over central-eastern North America using CMIP3 statistically downscaled data.
Contact: Michael Notaro, mnotaro@wisc.edu, for maps and David Lorenz, dlorenz@wisc.edu, for methods.
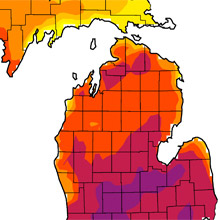
Central-Eastern North American Landscape Conservation Cooperatives (LCCs): Michigan Focus
Plot future projected tends in climate over central-eastern North America using CMIP3 statistically downscaled data.
Contact: Michael Notaro, mnotaro@wisc.edu, for maps and David Lorenz, dlorenz@wisc.edu, for methods.
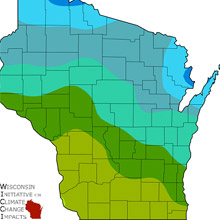
Wisconsin Initiative on Climate Change Impacts (WICCI)
Plot historical and future projected trends in climate over Wisconsin using CMIP3 statistically downscaled data.
Contact: Michael Notaro, mnotaro@wisc.edu
Wisconsin Initiative on Climate Change Impacts (WICCI): Analogs
Answer the question: “What climates today most resemble the future climates projected for my location in Wisconsin?”
Contact: Steve Vavrus, sjvavrus@wisc.edu
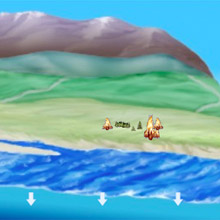
Carbon Cycle Website
Website for carbon cycle education, including an interactive applet for global carbon budget that allows users to make their own predictions for future state of atmospheric carbon dioxide.
Contact: Galen McKinley, mckinley@ldeo.columbia.edu