The source of observed data was from roughly 4,100 weather stations measuring daily maximum temperature, minimum temperature, and precipitation during 1950-2009 in 10 of the central-eastern North American Landscape Conservation Cooperatives (LCCs), from the National Weather Service’s Cooperative Observer Program and Environment Canada’s Canadian Daily Climate Data.
Contact: Michael Notaro, mnotaro@wisc.edu, for maps and David Lorenz, dlorenz@wisc.edu, for information on methods.
View instructions for obtaining data.
Period of Change
Scenario
Variable
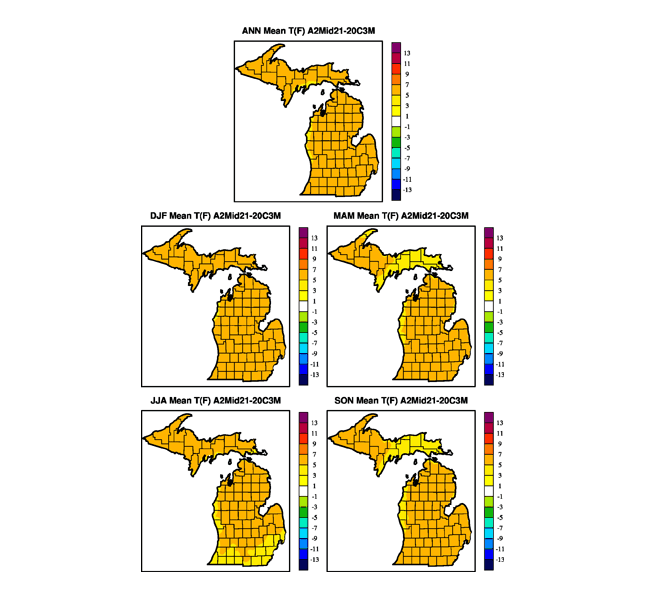
Projected Change in Temperature by the Mid 21st Century from the CNRM-RegCM4 Model
The climate output that was analyzed was produced by nine global climate models from the Coupled Model Intercomparison Project Phase 3 (CMIP3), a critical source of data to the Fourth Assessment Report of the Intergovernmental Panel on Climate Change (IPCC AR4). Results are based on three emission scenarios, A2, A1B, and B1, in the order of greatest greenhouse gas emissions to least emissions by the end of the century.
The coarse climate projections were downscaled to a 0.1° latitude x 0.1° longitude grid over 10 LCCs using a probabilistic approach that predicts the time-varying Probability Density Function of precipitation and maximum/minimum temperature at each point in the high resolution grid from daily climate model data. Station observations from the National Weather Service’s Cooperative Observer Program and from Environment Canada’s Canadian Daily Climate Data were used to train the statistical model.
The advantages of the probabilistic approach use here are: (1) realistic extremes, variance and means can be achieved without artificially inflating the sensitivity of the local climate to the large-scale climate, (2) flexibility to control the temporal and spatial de-correlation of a downscaled variable and the co-variability between two variables and (3) station data can be interpolated to a grid while also preserving the realistic extremes, variance and means of the method.
In computing the projected changes in a variable, the difference in the mean of that variable was computed from 1961-2000 to either 2046-2065 (mid-21st century) or 2081-2100 (late 21st century). More information is also available.
This is an accordion element with a series of buttons that open and close related content panels.
Variable Descriptions
Temperature
Average temperature (degrees Fahrenheit) for each day is computed by adding the daily maximum and minimum temperatures and dividing by two.
Precipitation
Average seasonal or annual precipitation is shown in inches.
Maximum Temperature
Average daily maximum (daily high) temperature is shown in degrees Fahrenheit.
Minimum Temperature
Average daily minimum (daily low) temperature is shown in degrees Fahrenheit.
Diurnal Temperature Range
Average diurnal temperature (degrees Fahrenheit) is computed by substracting the average daily minimum temperature from the average daily maximum temperature.
Growing Season Length
The length of the growing season is defined here as the number of days between the last spring freeze and first autumn freeze, where a freeze is when the daily low temperature drops below 32°F.
Date of First Fall Freeze
The first fall freeze is defined as the first day, after mid-summer, with a low temperature below 32°F.
Date of Last Spring Freeze
The last spring freeze is defined as the last day, between January 1 and mid-summer, with a low temperature below 32°F.
Growing degree days
Growing degree days (GDDs) for a single day are computed here as the number of degrees Fahrenheit that the daily mean temperature exceeds 50°F. So, two d ays with daily mean temperatures of 75°F and 40°F have 25 and 0 GDDs, respectively. For annual total GDDs, the GDDs for each day are summed.
Freezing degree days
Freezing degree days (FDDs) for a single day are computed here as the number of degrees Fahrenheit that the daily mean temperature is below 32°F. So, two days with daily mean temperatures of 20°F and 40°F have 12 and 0 FDDs, respectively. For annual total FDDs, the FDDs for each day are summed.
Cooling degree days
Cooling degree days (CDDs) for a single day are computed here as the number of degrees Fahrenheit that the daily mean temperature exceeds 65°F. So, two days with daily mean temperatures of 75°F and 50°F have 10 and 0 CDDs, respectively. For annual total CDDs, the CDDs for each day are summed.
Heating degree days
Heating degree days (HDDs) for a single day are computed here as the number of degrees Fahrenheit that the daily mean temperature is below 65°F. So, two days with daily mean temperatures of 50°F and 75°F have 15 and 0 HDDs, respectively. For annual total HDDs, the HDDs for each day are summed.
Nights Below 0F
Cold Nights: Mean number of nights each year with a low temperature below 0F.
Days Below 20F
Cold Days: Mean number of days each year with a high temperature below 20F.
Days Above 90F
Hot Days: Mean number of days each year with a high temperature above 90F.
Days Above 100F
Hot Days: Mean number of days each year with a high temperature above 100F.
Frequency of 1″ precipitation events
The frequency of 1″ precipitation events is defined here as the number of days per decade with precipitation of at least one inch.
Frequency of 2″ precipitation events
The frequency of 2″ precipitation events is defined here as the number of days per decade with precipitation of at least two inches.
Frequency of 3″ precipitation events
The frequency of 3″ precipitation events is defined here as the number of days per decade with precipitation of at least three inches.
Snowfall
Annual snowfall (top – cm, bottom – %), determined by forcing the SNOW-17 model with the LCC statistical downscaling data.
Snow Depth
Nov-April mean snow depth (top – cm, bottom – %), determined by forcing the SNOW-17 model with the LCC statistical downscaling data.
Days With Snowpack
Mean number of days per year with a snowpack of at least 1 cm (top – days, bottom – %), determined by forcing the SNOW-17 model with the LCC statistical downscaling data.
Days With Snowpack 10″+
Mean number of days per year with a snowpack of at least 10 inches (top – days, bottom – %), determined by forcing the SNOW-17 model with the LCC statistical downscaling data.
Days With Snowfall
Mean number of days per year with a snowfall of at least 1 cm (top – days, bottom – %), determined by forcing the SNOW-17 model with the LCC statistical downscaling data.
Winter Severity Index
Winter Severity Index (WSI), relevant for white-tailed deer, based on frequency of days with 18″+ snow depth on ground and minimum temperature less than 0F.
Temp Spread
Spread in mean temperature (degrees Fahrenheit) changes by month by specific LCC region. View a map of the LCC regions.
Prec Spread
Spread in mean precipitation (inches) changes by month by specific LCC region. View a map of the LCC regions.
CMIP3 Models
- CCCMA_CGCM3_1 = Canadian Centre for Climate Modelling and Analysis
- CNRM_CM3 = Meteo-France / Centre National de Recherches Meteorologiques
- CSIRO_MK3_0 = CSIRO Atmospheric Research, Australia
- CSIRO_MK3_5 = CSIRO Atmospheric Research, Australia
- GFDL_CM2_0 = US Department of Commerce / NOAA / Geophysical Fluid Dynamics Laboratory
- GISS_MODEL_E_R = NASA / Goddard Institute for Space Studies, US
- MIUB_ECHO_G = Meteorological Institute University of Bonn, Germany
- MPI ECHAM5 = Max Planck Institute for Meteorology, Germany
- MRI_CGCM2_3_2a = Meteorological Research Institute, Japan
Developers
The statistical downscaling of climate projections was performed by Dr. David Lorenz, and the analysis, map production, and website development was performed by Dr. Michael Notaro, both at the Nelson Center for Climatic Research, University of Wisconsin-Madison.
Project Funding
The statistical downscaling project was funded by: (1) Michigan Department of Natural Resources through an Environmental Protection Agency grant with the Great Lakes Restoration Initiative, (2) Upper Midwest and Great Lakes Landscape Conservation Cooperative, and (3) Wisconsin Focus on Energy.
Acknowledgements
The downscaling was funded by grants and contracts from NOAA/Climate Change Data and Detection, NOAA Great Lakes Environmental Research Laboratory (EPA grant), Michigan Department of Natural Resources (EPA grant), Northeast Climate Science Center, and National Science Foundation. We acknowledge the World Climate Research Programme’s Working Group on Coupled Modelling, which is responsible for CMIP, and we thank the climate modeling groups for producing and makign available their model output.
For CMIP, the U.S. Department of Energy’s Program for Climate Model Diagnosis and Intercomparison provides coordinating support and led development of software infrastructure in partnership with the Global Organization for Earth System Science Portals. Computational resources were provided through NCAR and the Teragrid from the University of Texas at Austin and the University of Illinois at Urbana-Champaign.
Questions/comments should be addressed to Michael Notaro at mnotaro@wisc.edu.