Plot future projected trends in climate over the Midwest U.S. and Great Lakes Basin using CMIP5 dynamically downscaled data.
Contact: Michael Notaro, mnotaro@wisc.edu
Period of Change
Model
Variable
Projected Change in Temperature by the Mid 21st Century from the CNRM-RegCM4 Model
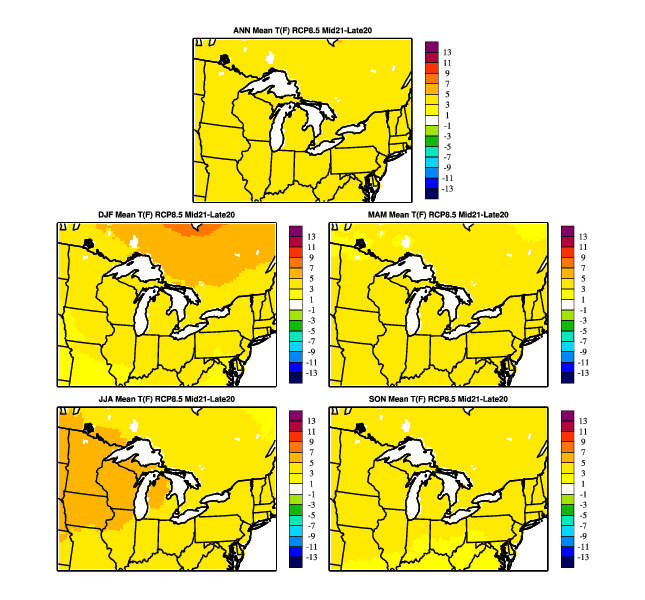
Six global climate models (GCMs) from the Coupled Model Intercomparison Project Phase Five (CMIP5) have been dynamically downscaled to 25-km grid spacing according to the RCP8.5 scenario using the International Centre for Theoretical Physics (ICTP) Regional Climate Model Version Four (RegCM4).
These GCMs include the Centre National de Recherches Meteorologiques Coupled Global Climate Model Version Five (CNRM-CM5), the Model for Interdisciplinary Research on Climate Version Five (MIROC5), the Institut Pierre Simon Laplace Coupled Model Version Five-Medium Resolution (IPSL-CM5-MR), the Meteorological Research Institute Coupled Global Climate Model Version Three (MRI-CGCM3), the Centre for Australian Weather and Climate Research, Australia GCM (ACCESS1-0), and the National Oceanic and Atmospheric Administration Geophysical Fluid Dynamics Laboratory model (GFDL-ESM2M).
This is an accordion element with a series of buttons that open and close related content panels.
Variable Descriptions
Temperature
Average daily temperature (degrees Fahrenheit).
Precipitation
Average seasonal or annual precipitation in inches.
Maximum Temperature
Average daily high temperature (degrees Fahrenheit), based on hourly data.
Minimum Temperature
Average daily low temperature (degrees Fahrenheit), based on hourly data.
Diurnal Temperature Range
Average diurnal temperature range (degrees Fahrenheit), computed by substracting the average daily low temperature from the average daily high temperature.
Growing Season Length
Average growing season length, computed as the mean number of days between the last spring freeze and first autumn freeze, where a freeze is when the daily low temperature drops below 32°F.
Date of First Fall Freeze
First fall freeze, defined as the first day, after mid-summer, with a low temperature below 32°F.
Date of Last Spring Freeze
Last spring freeze, defined as the last day, between January 1 and mid-summer, with a low temperature below 32°F.
Growing degree days
Growing degree days (GDDs) for a single day are computed here as the number of degrees Fahrenheit that the daily mean temperature exceeds 50°F. So, two d ays with daily mean temperatures of 75°F and 40°F have 25 and 0 GDDs, respectively. For annual total GDDs, the GDDs for each day are summed.
Freezing degree days
Freezing degree days (FDDs) for a single day are computed here as the number of degrees Fahrenheit that the daily mean temperature is below 32°F. So, two days with daily mean temperatures of 20°F and 40°F have 12 and 0 FDDs, respectively. For annual total FDDs, the FDDs for each day are summed.
Cooling degree days
Cooling degree days (CDDs) for a single day are computed here as the number of degrees Fahrenheit that the daily mean temperature exceeds 65°F. So, two days with daily mean temperatures of 75°F and 50°F have 10 and 0 CDDs, respectively. For annual total CDDs, the CDDs for each day are summed.
Heating degree days
Heating degree days (HDDs) for a single day are computed here as the number of degrees Fahrenheit that the daily mean temperature is below 65°F. So, two days with daily mean temperatures of 50°F and 75°F have 15 and 0 HDDs, respectively. For annual total HDDs, the HDDs for each day are summed.
Nights Below 0F
Cold Nights: Mean number of nights each year with a low temperature below 0F.
Days Below 20F
Cold Days: Mean number of days each year with a high temperature below 20F.
Days Above 90F
Hot Days: Mean number of days each year with a high temperature above 90F.
Days Above 100F
Hot Days: Mean number of days each year with a high temperature above 100F.
Days With Precipitation
Mean number of days per year with precipitation of at least 1 mm.
Frequency of 1″ precipitation events
Frequency of 1″ precipitation events, defined here as the number of days per decade with precipitation of at least one inch.
Frequency of 2″ precipitation events
Frequency of 2″ precipitation events, defined here as the number of days per decade with precipitation of at least two inches.
Frequency of 3″ precipitation events
Frequency of 3″ precipitation events, defined here as the number of days per decade with precipitation of at least three inches.
Sea-Level Pressure
Average sea-level pressure in hPa (mb).
Near Surface Specific Humidity
Average near-surface specific humidity in g/kg.
Evapotranspiration
Average actual total evapotranspiration (inches/year or inches/season).
Cloud Cover Fraction
Average cloud cover fraction (fraction).
Duration of Sunshine
Mean length of daily sunshine in seconds.
Upper Soil Moisture
Mean upper soil moisture fraction in kg/m2.
Lower Soil Moisture
Mean lower soil moisture fraction in kg/m2.
Snowfall
Annual mean snowfall (top – cm, bottom – %).
Liquid Snow Depth
Mean November-April liquid-equivalent snow depth (top – kg/m2, bottom – %).
Days With Snowfall
Mean number of days per year with a snowfall of at least 1 cm (top – days, bottom – %).
References
Notaro, M., V. Bennington, and S. Vavrus, 2015: Dynamically downscaled projections of lake-effect snow in the Great Lakes Basin. Journal of Climate, 28, 1661-1684.
Notaro, M., V. Bennington, and B. Lofgren, 2015: Dynamical downscaling-based projections of Great Lakes’ water levels. Journal of Climate, 28, 9721-9745.
Acknowledgements
The downscaling was funded by grants and contracts from NOAA/Climate Change Data and Detection, NOAA Great Lakes Environmental Research Laboratory (EPA grant), Michigan Department of Natural Resources (EPA grant), Northeast Climate Science Center, and National Science Foundation.
We acknowledge the World Climate Research Programme’s Working Group on Coupled Modelling, which is responsible for CMIP, and we thank the climate modeling groups for producing and making available their model output. For CMIP, the U.S. Department of Energy’s Program for Climate Model Diagnosis and Intercomparison provides coordinating support and led development of software infrastructure in partnership with the Global Organization for Earth System Science Portals.
Computational resources were provided through NCAR and the Teragrid from the University of Texas at Austin and the University of Illinois at Urbana- Champaign. Questions/comments should be addressed to Michael Notaro at mnotaro@wisc.edu.
Developers
The dynamical downscaling of climate projections was performed by Drs. Val Bennington and Yafang Zhong. The analysis, map production, and website development was performed by Dr. Michael Notaro. All three scientists are/were employed within the Nelson Institute Center for Climatic Research, University of Wisconsin–Madison.